The maps in reporting services miss one important feature: dynamic zoom. By this, I mean the ability for a user to zoom into the map while looking at the report and panning around to see the locations of interest. This is necessary for instance when you display the world map and wish to zoom into smaller countries or specific areas.
Unfortunately I did not find any ideal solution to this issue, however I will present here a (somewhat) acceptable solution, that allows the user to tweak zoom level while automatically centering on the locations of interest.
To start, I created a basic report that displays the world map, and visualizes country data from the AdventureWorksDW by color. For simplicity, I removed the legend and color scale, and this is what I have:
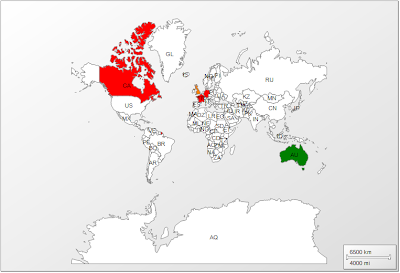 |
| Figure 1 - Starting map |
The sample includes very few countries but that's okay.
What we will do is allow the user to specify the countries of interest, and the map automatically centers itself between those countries.
I modify my data set to take a list of countries as a parameter, and then add the list of countries as a report parameter.
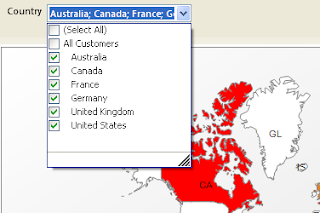 |
| Figure 2 - Countries parameter |
The next step is to enable the automatic-centering between the countries of interest. To show you what I mean, I (for now) manually zoomed into the map and then with the report running, I selected only Australia. Figure 3 shows the result.
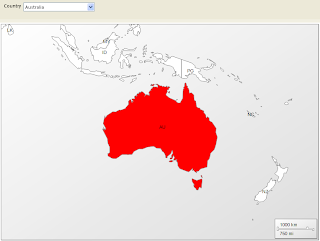 |
| Figure 3 - Map automatically centers on Australia |
In order to do this, right click on the map (away from the polygons) and choose "Viewport Properties". Go into the "Center and Zoom" tab, and under "Change map view center and zoom options", select "Center map to show all data-bound map elements" as in the screenshot below.
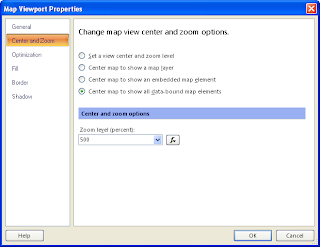 |
| Figure 4 - Center map |
Finally we need the ability to dynamically change the zoom level. This is the not-that-nice part, but it is so far the only possible way I found. In the same window as Figure 4, there is a Zoom level field. What we can do is create a report parameter of type integer (with default of 100) (Figure 5), and then link this zoom field to that parameter using expressions.
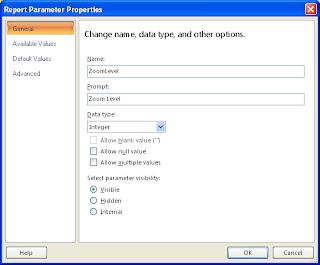 |
| Figure 5 - ZoomLevel parameter |
I called the parameter ZoomLevel, and now the viewport properties looks like Figure 6.
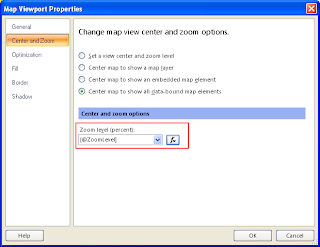 |
| Figure 6 - Map zoom level from parameter |
The result is that the users can select countries of interest and then tweak the zoom level as they desire. For instance, I ran the report and chose Germany and United Kingdom as countries, and set the zoom level parameter to 1500, achieving the following result:
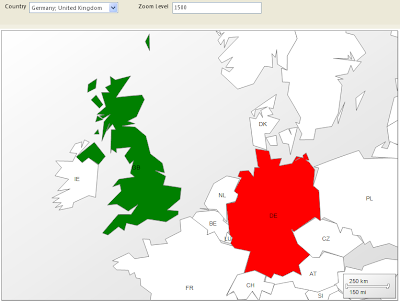 |
| Figure 7 - Map centered and zoomed |
This solution is still far from the comfort of using the mouse wheel for zooming, and dragging the mouse to pan around. However I have not found any other better way. Some interactivity with the map would be an appreciated feature of Reporting Services.
tags: reporting services report builder 3.0 maps dynamic zoom automatic


Good
ReplyDeleteHi
ReplyDeleteSounds easy to get the a basic zoom functionality! But it doesn't work for me! i get allways a blank viewport area when I run the report local in BIDS and that without using of a parameter to select only a few countries which will be bound with analytical data. So what could be my problem?
I am having the same problem......getting a blank viewport area
DeleteHi,
ReplyDeleteYou can make this better by then adding 2 images/text boxes for the zoom in/out buttons.
And the on click action can take you to the same report, but add or subtract 10 from the zoom parameter - in effect giving you zoom control
That can work too! It's a little more user friendly than arbitrary numbers, however the downside is that smaller countries require really large zoom levels of over a 1000.
DeleteI have implemented this with panning and zooming. It was quite easy really. SSRS is very impressive really. Now i think it is usable.Not as good as the normal zooming and panning but something easy to implmement and usable.
DeleteHere is a picture of the map after zooming:
https://www.facebook.com/photo.php?fbid=10152255929249760&set=a.10151276096394760.477912.500294759&type=1&theater
Ali Tawij,
DeleteHow did you get SSRS to pan and zoom over a map?? No matter what I center the map on in deisgn mode, when I goto preview -- SSRS display some other random part of my map.
Excellent, thankyou for that.
ReplyDeleteOh and I did the panning by just adding and subtracting 10 from the x and y fields in the viewport zoom tab. Normally it is centred at 50,50. And the port screen is a percentage from 0 to 100 for x and y. So its easy to do the panning. For the Zooming i just multiply or divide by 5 when + or - is clicked.
ReplyDelete